The Process
My colleagues in Service Management within IT solicited me to conduct user research on the CSU system ticketing platform, ServiceNow, to better understand diverse user perspectives and to prioritize opportunities for improvement. I conducted focus groups with staff from eight departments that use ServiceNow, considered the experiences of two primary categories (requestors and fulfillers), found a set of common challenges, and lastly suggested recommendations and longer-term goals for ITSM to consider. Users shared challenges that span a lack of timely training and consistent processes, form interface and design issues, and inefficient communications. Users also shared a range of recommendations, including assistive tools, streamlined processes and notifications, and other hinting features that would improve the user experience for both fulfillers and requestors.
To build my department's service portfolio with more design strategy and user research case studies, I actively tracked the hours dedicated to this project. Acting as a UX consultant and team of one, I allotted my team into five main categories: administrative (project planning, correspondence), meetings (meeting with stakeholders and ITSM), data collection (conducting focus groups, reviewing notes), analysis (coding data manually and with MAXQDA software), and design (creating data visualizations, drafting report design). I dedicated a total of 96 hours and 45 minutes to this research project:
- Administrative: 9 hours, 55 minutes
- Meetings: 3 hours, 10 minutes
- Data Collection: 4 hours, 25 minutes
- Analysis: 45 hours
- Design: 34 hours, 15 minutes
Focus Groups
I conducted focus groups to gather qualitative data and narratives of staff members' experiences using ServiceNow. The departments and workgroups I interviewed were: Access Services, Contract Services & Procurement/ITS Finance, Common Management Systems (Campus Solutions, Common Financial Systems, Common Human Resources System), IT Support System, and Multimedia Services.
Focus groups were conducted on Zoom.
Coding with MAXQDA
I began coding focus group transcripts manually by tracking themes and motifs from participants. I later took advantage of a trial of MAXQDA to synthesize and code the qualitative data. From the data analysis, eight prominent themes emerged:
- Training & Resources
- Form Details
- Streamlining & Efficiency
- Communications
- User Interfaces
- Notifications
- Customizations
- Integrations
Suggest Goals
While I peppered proposed solutions for each of the major themes throughout the report (such as embedding assistive tools in dashboards and refining the mobile experience), I also included three longer term goals for ITSM to consider and incorporate in their plans:
- Reimagine and streamline processes to be consistent across end user departments
- Establish a roadmap of governance of ServiceNoe across the CSU
- Consult Change Management in the Project & Change Management Office (PCMO) to help deploy an updated, streamlined version of ServiceNow to users and stakeholders
Data Visualizations
From the qualitative data, I created several visualizations to support the findings.
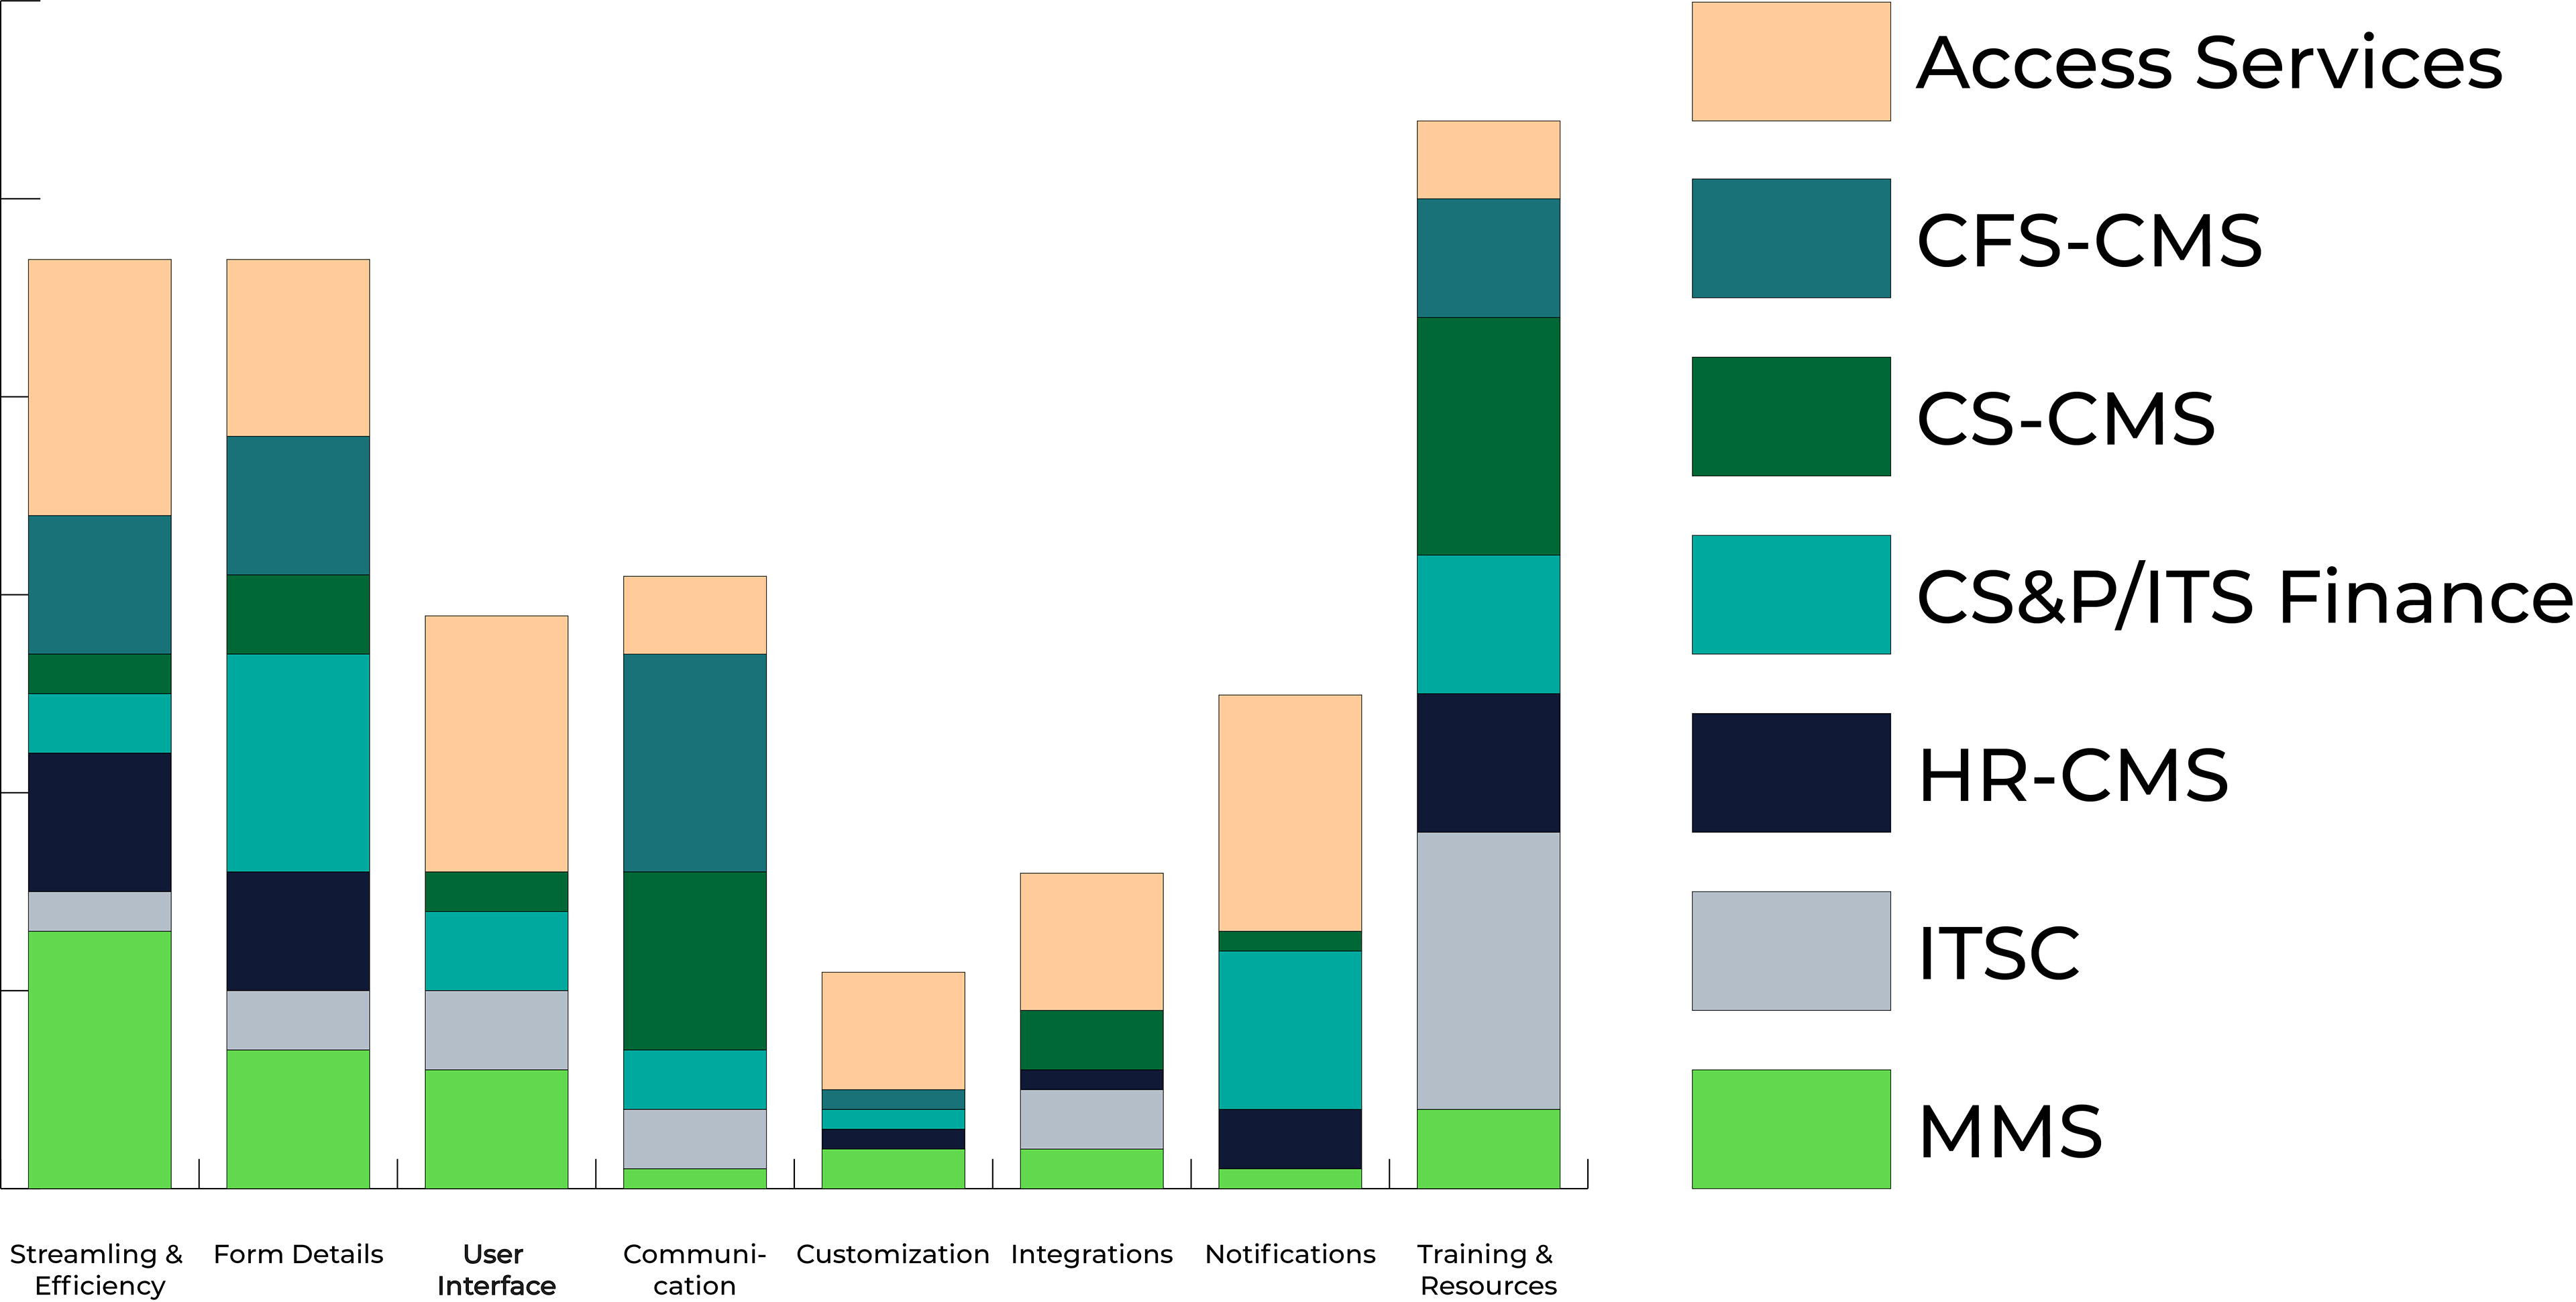
Most Prevalent Themes
Different work groups expressed different concerns and problem areas. There is no one-size-fits-all solution for all departments, but ITSM can use the following chart to determine which themes were most relevant to particular work groups.
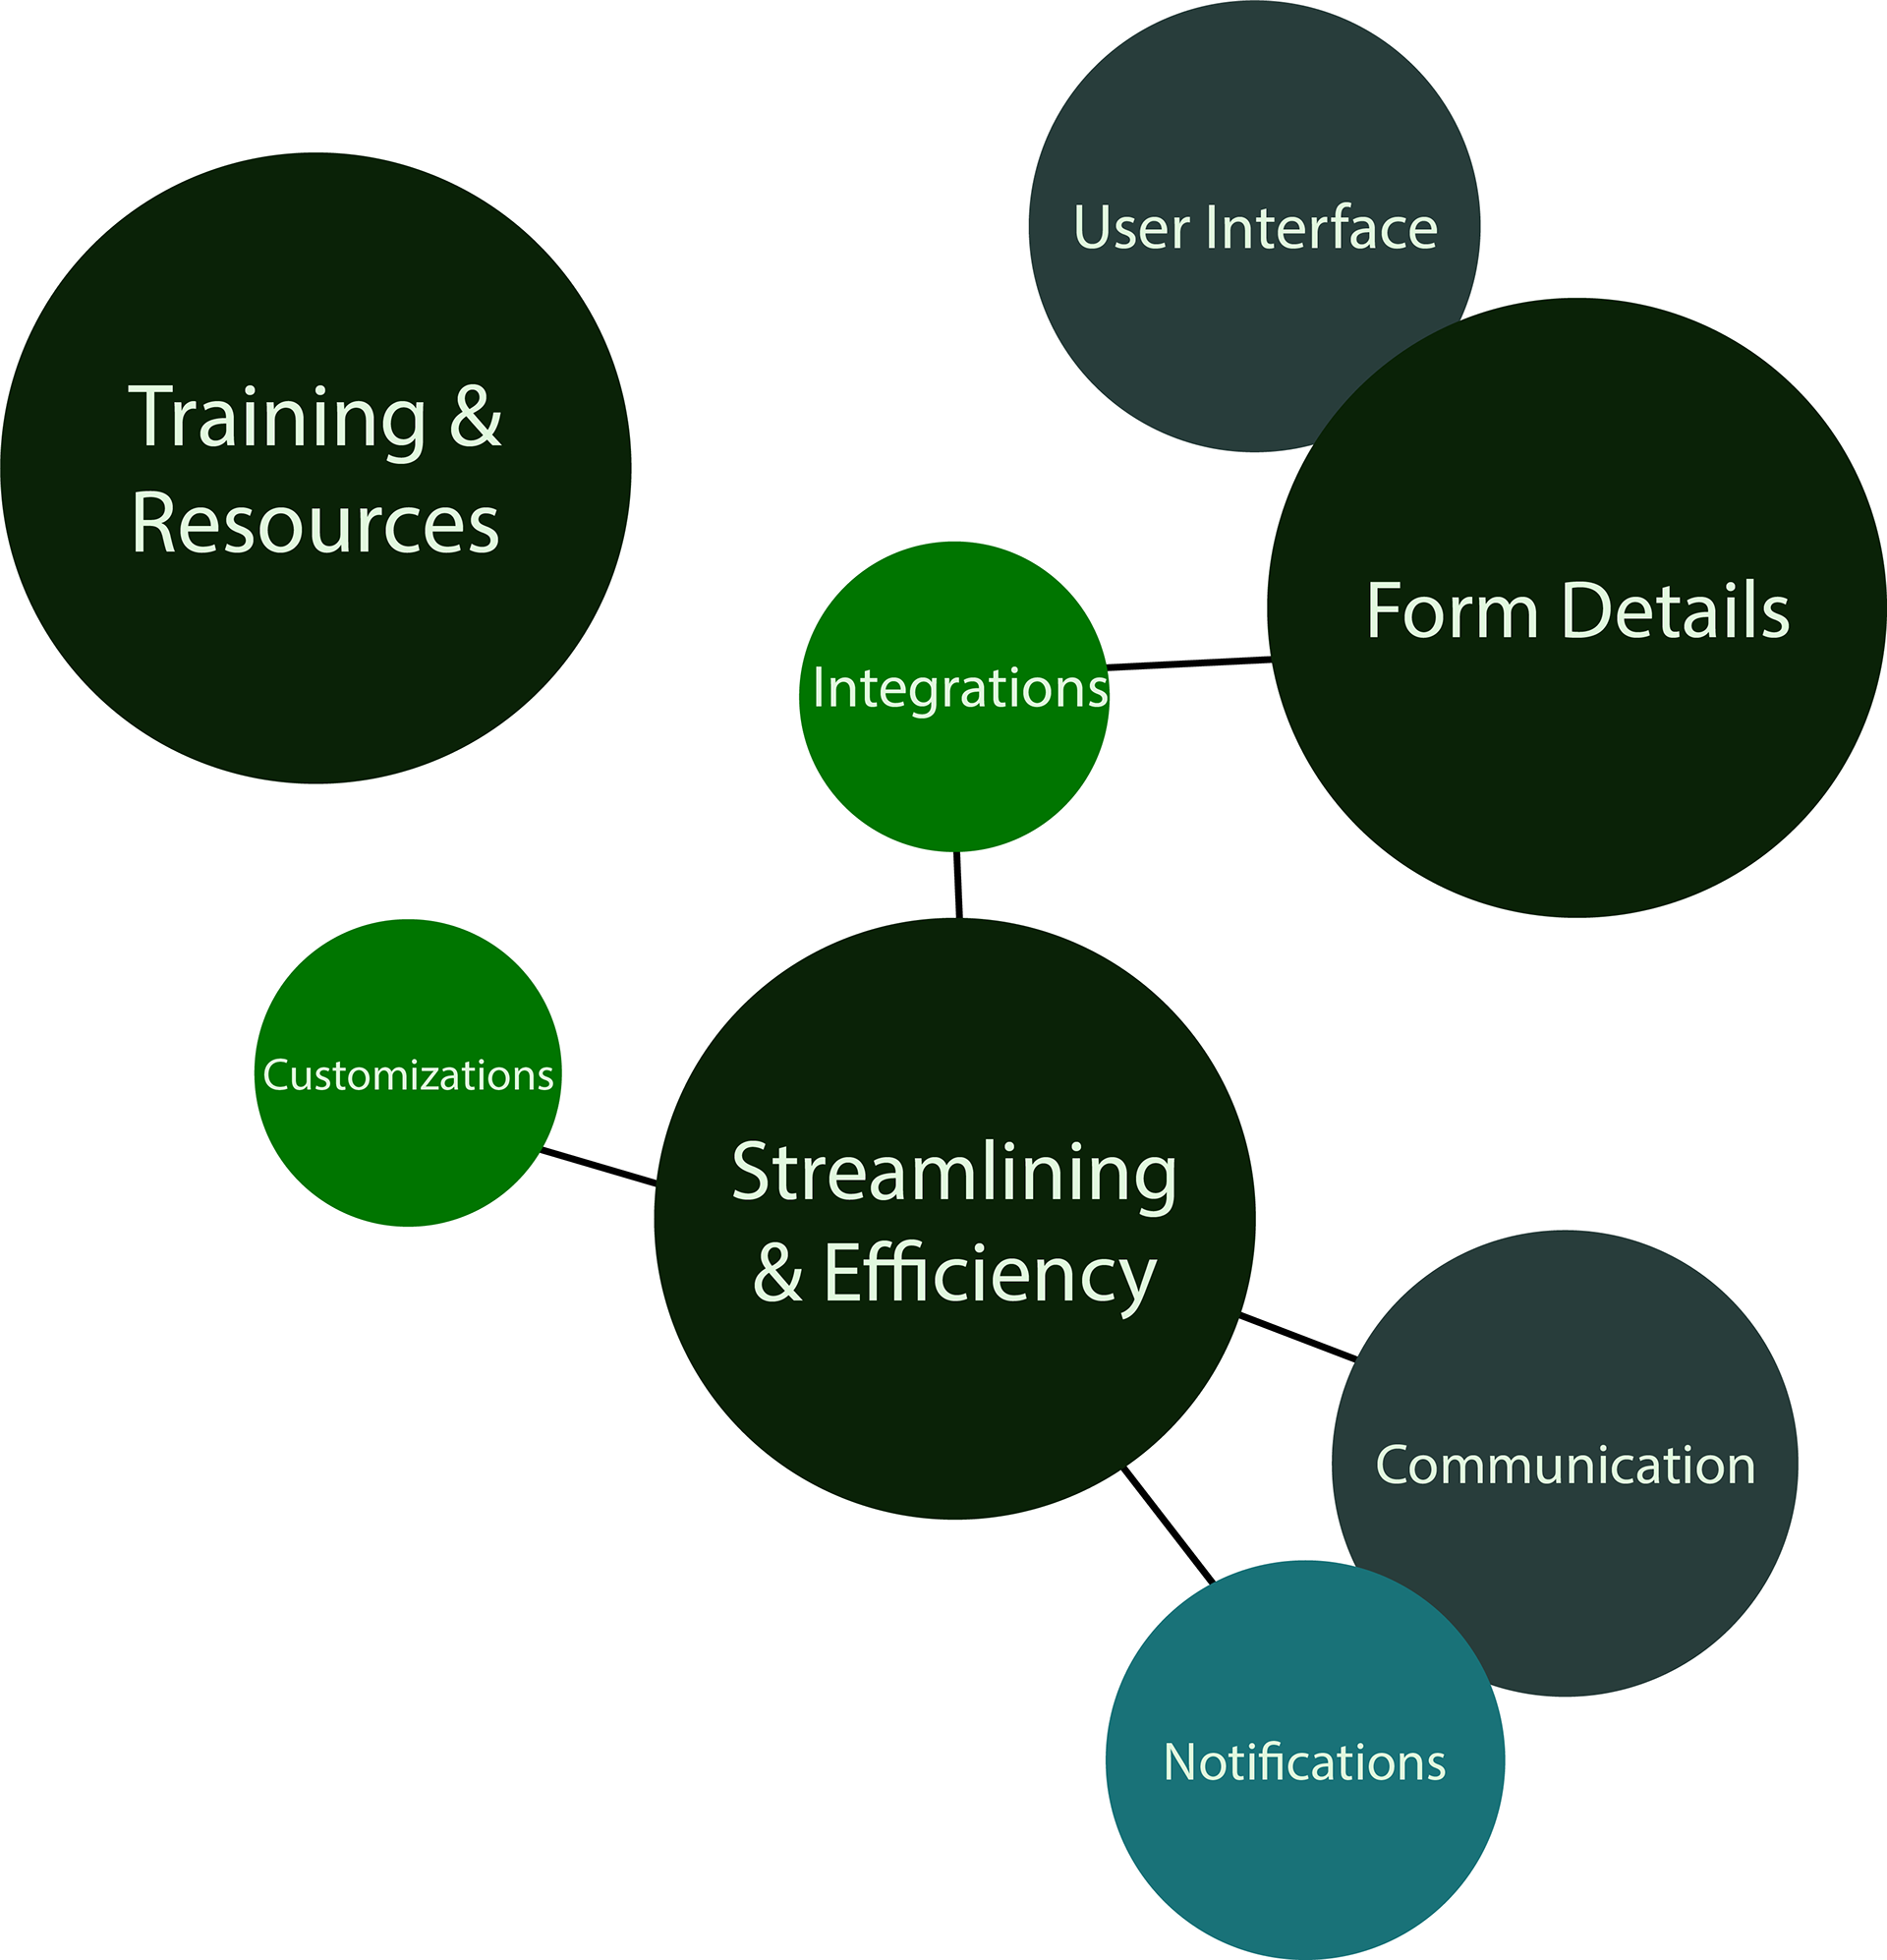
Theme Connectivity
As mentioned in the data analysis, many themes and sub-themes are connected. Enhancing one area may benefit another complimenting area. For example, improving work flows in forms can enhance the overall user experience and helping employees customize thier dashboards and general ServiceNow experience can assist with streamlining and efficiency. The web graphic below shows interconnectivity between themes. Other connections may exist; this is just one of several combinations.
User Personas
From the focus groups and observations, I developed three distinct user personas as archetypes to generate empathy and illuminate the various views and needs of the users surveyed. Two personas represented typical users with specific use cases while one was an atypical user to encourage inclusive design thinking as teams moved into the prototype and design phases.
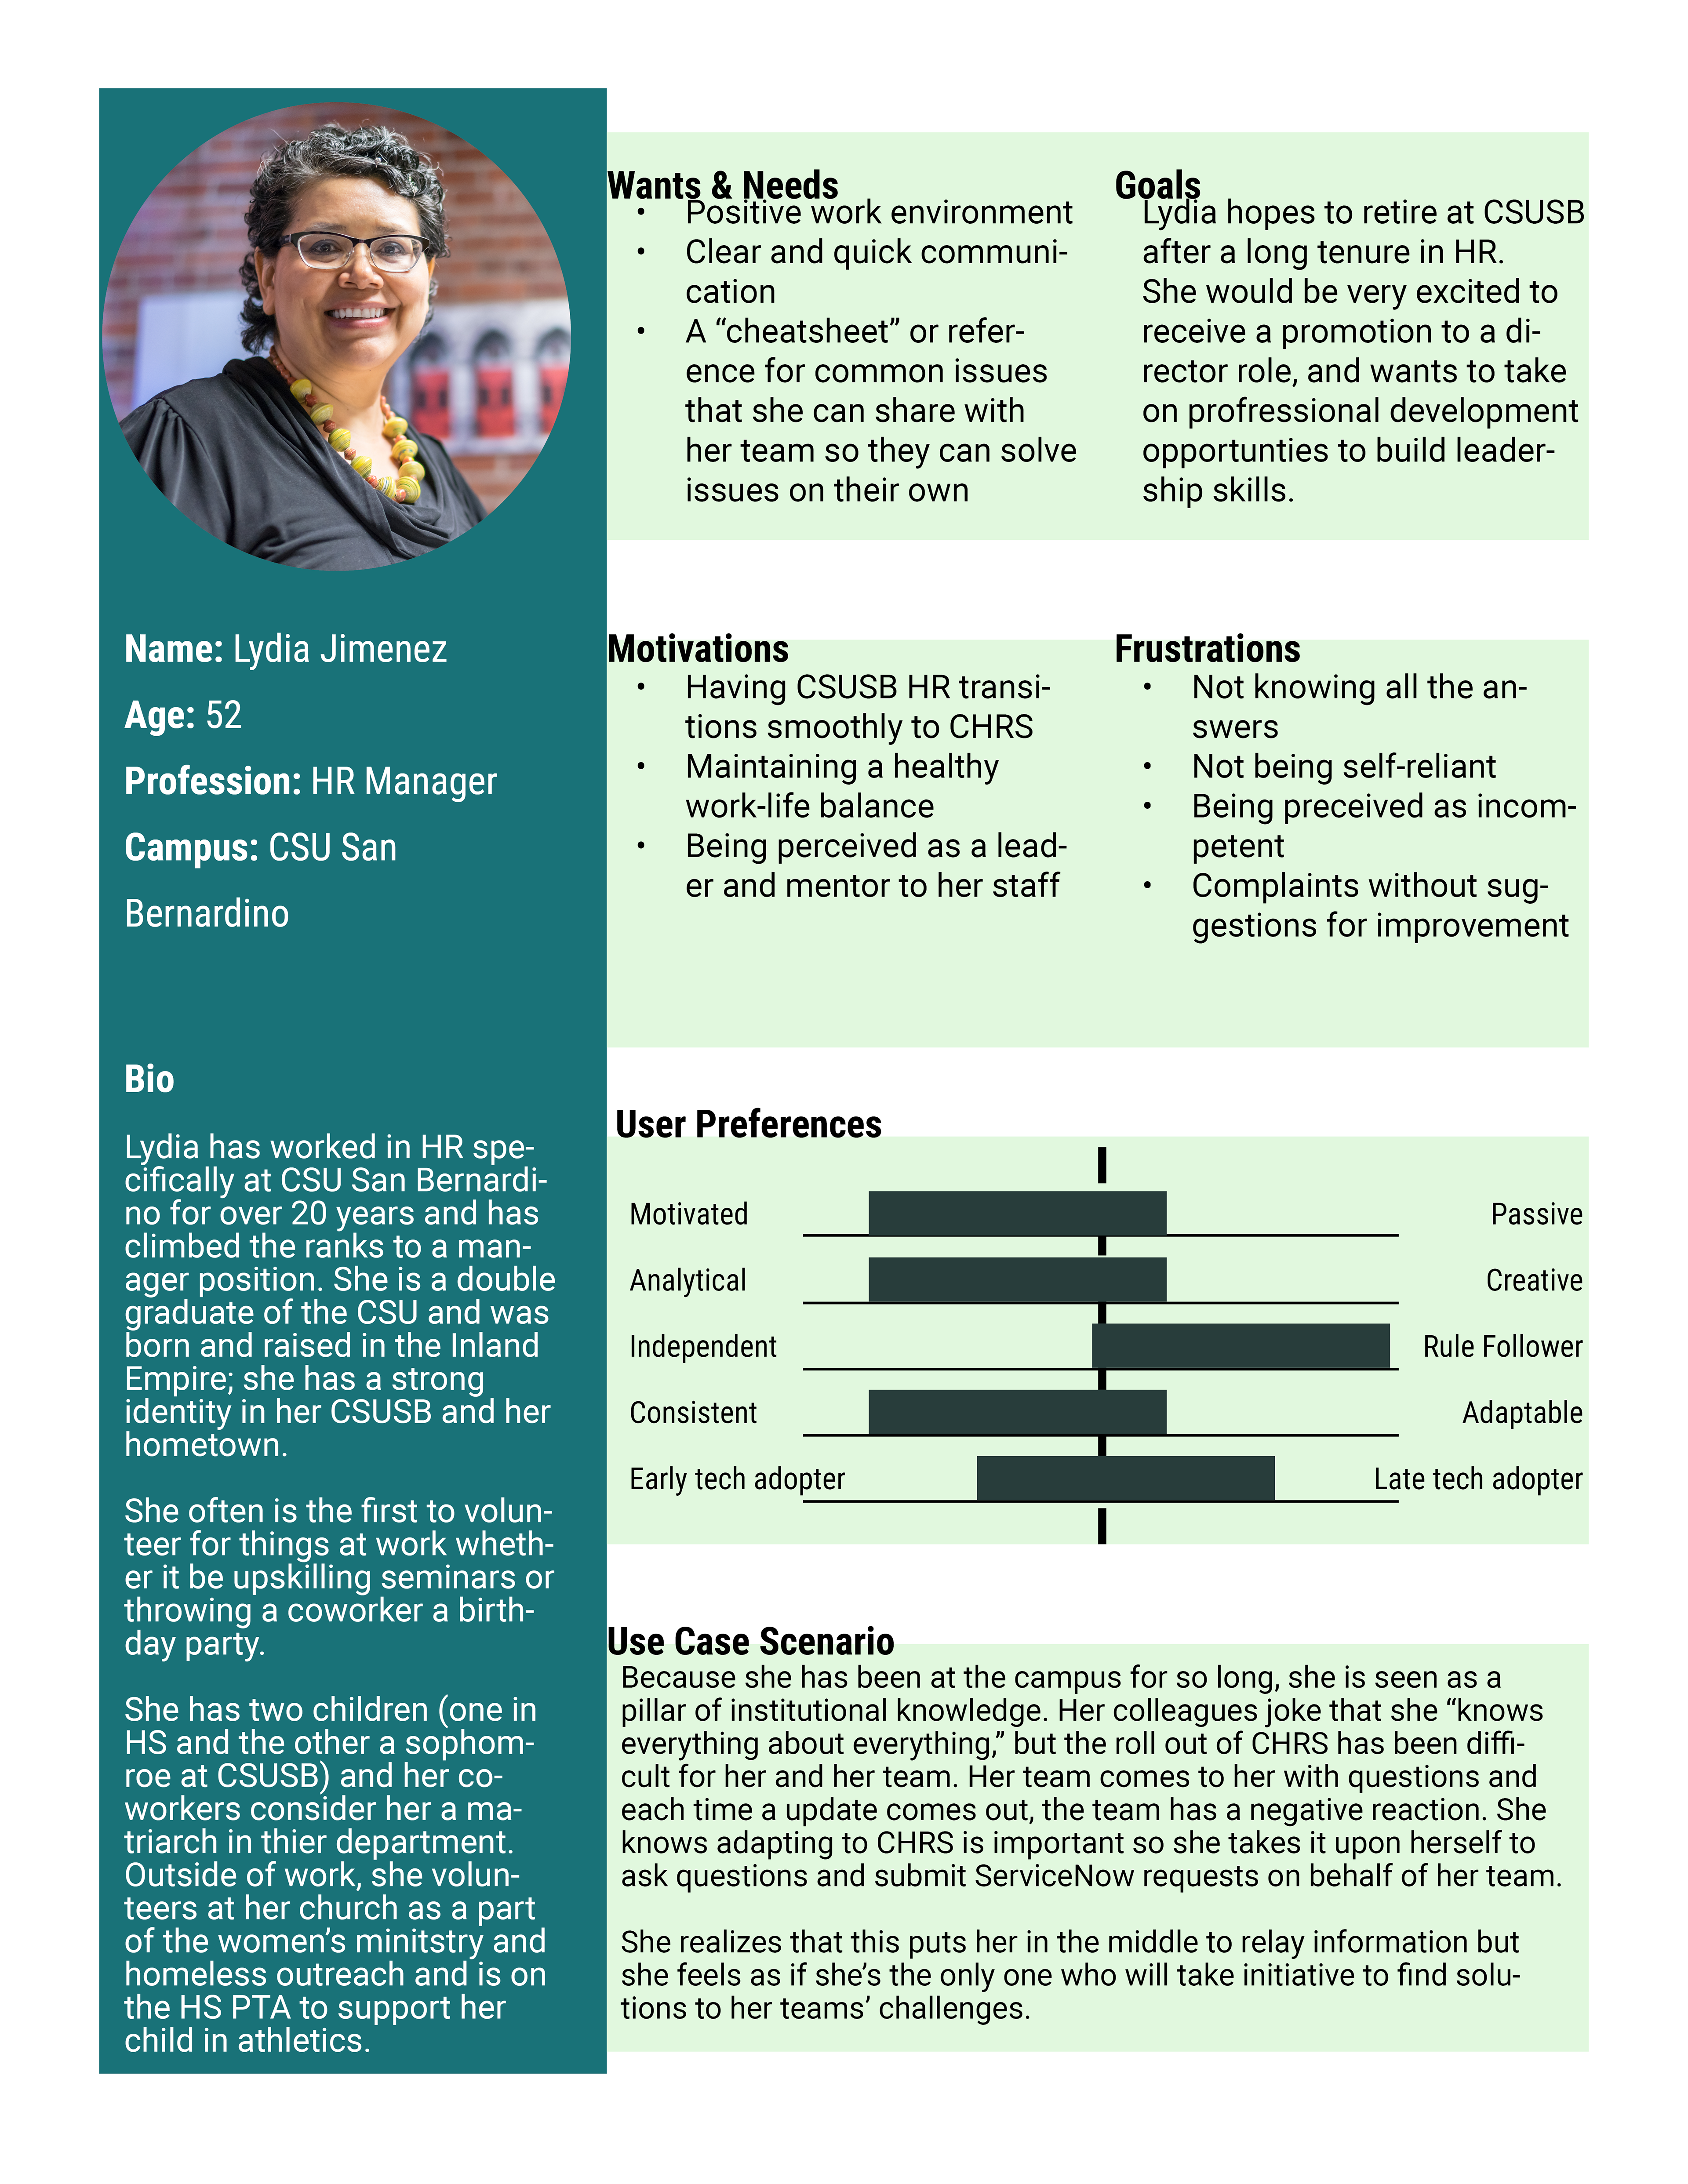
User Persona - "Lydia"
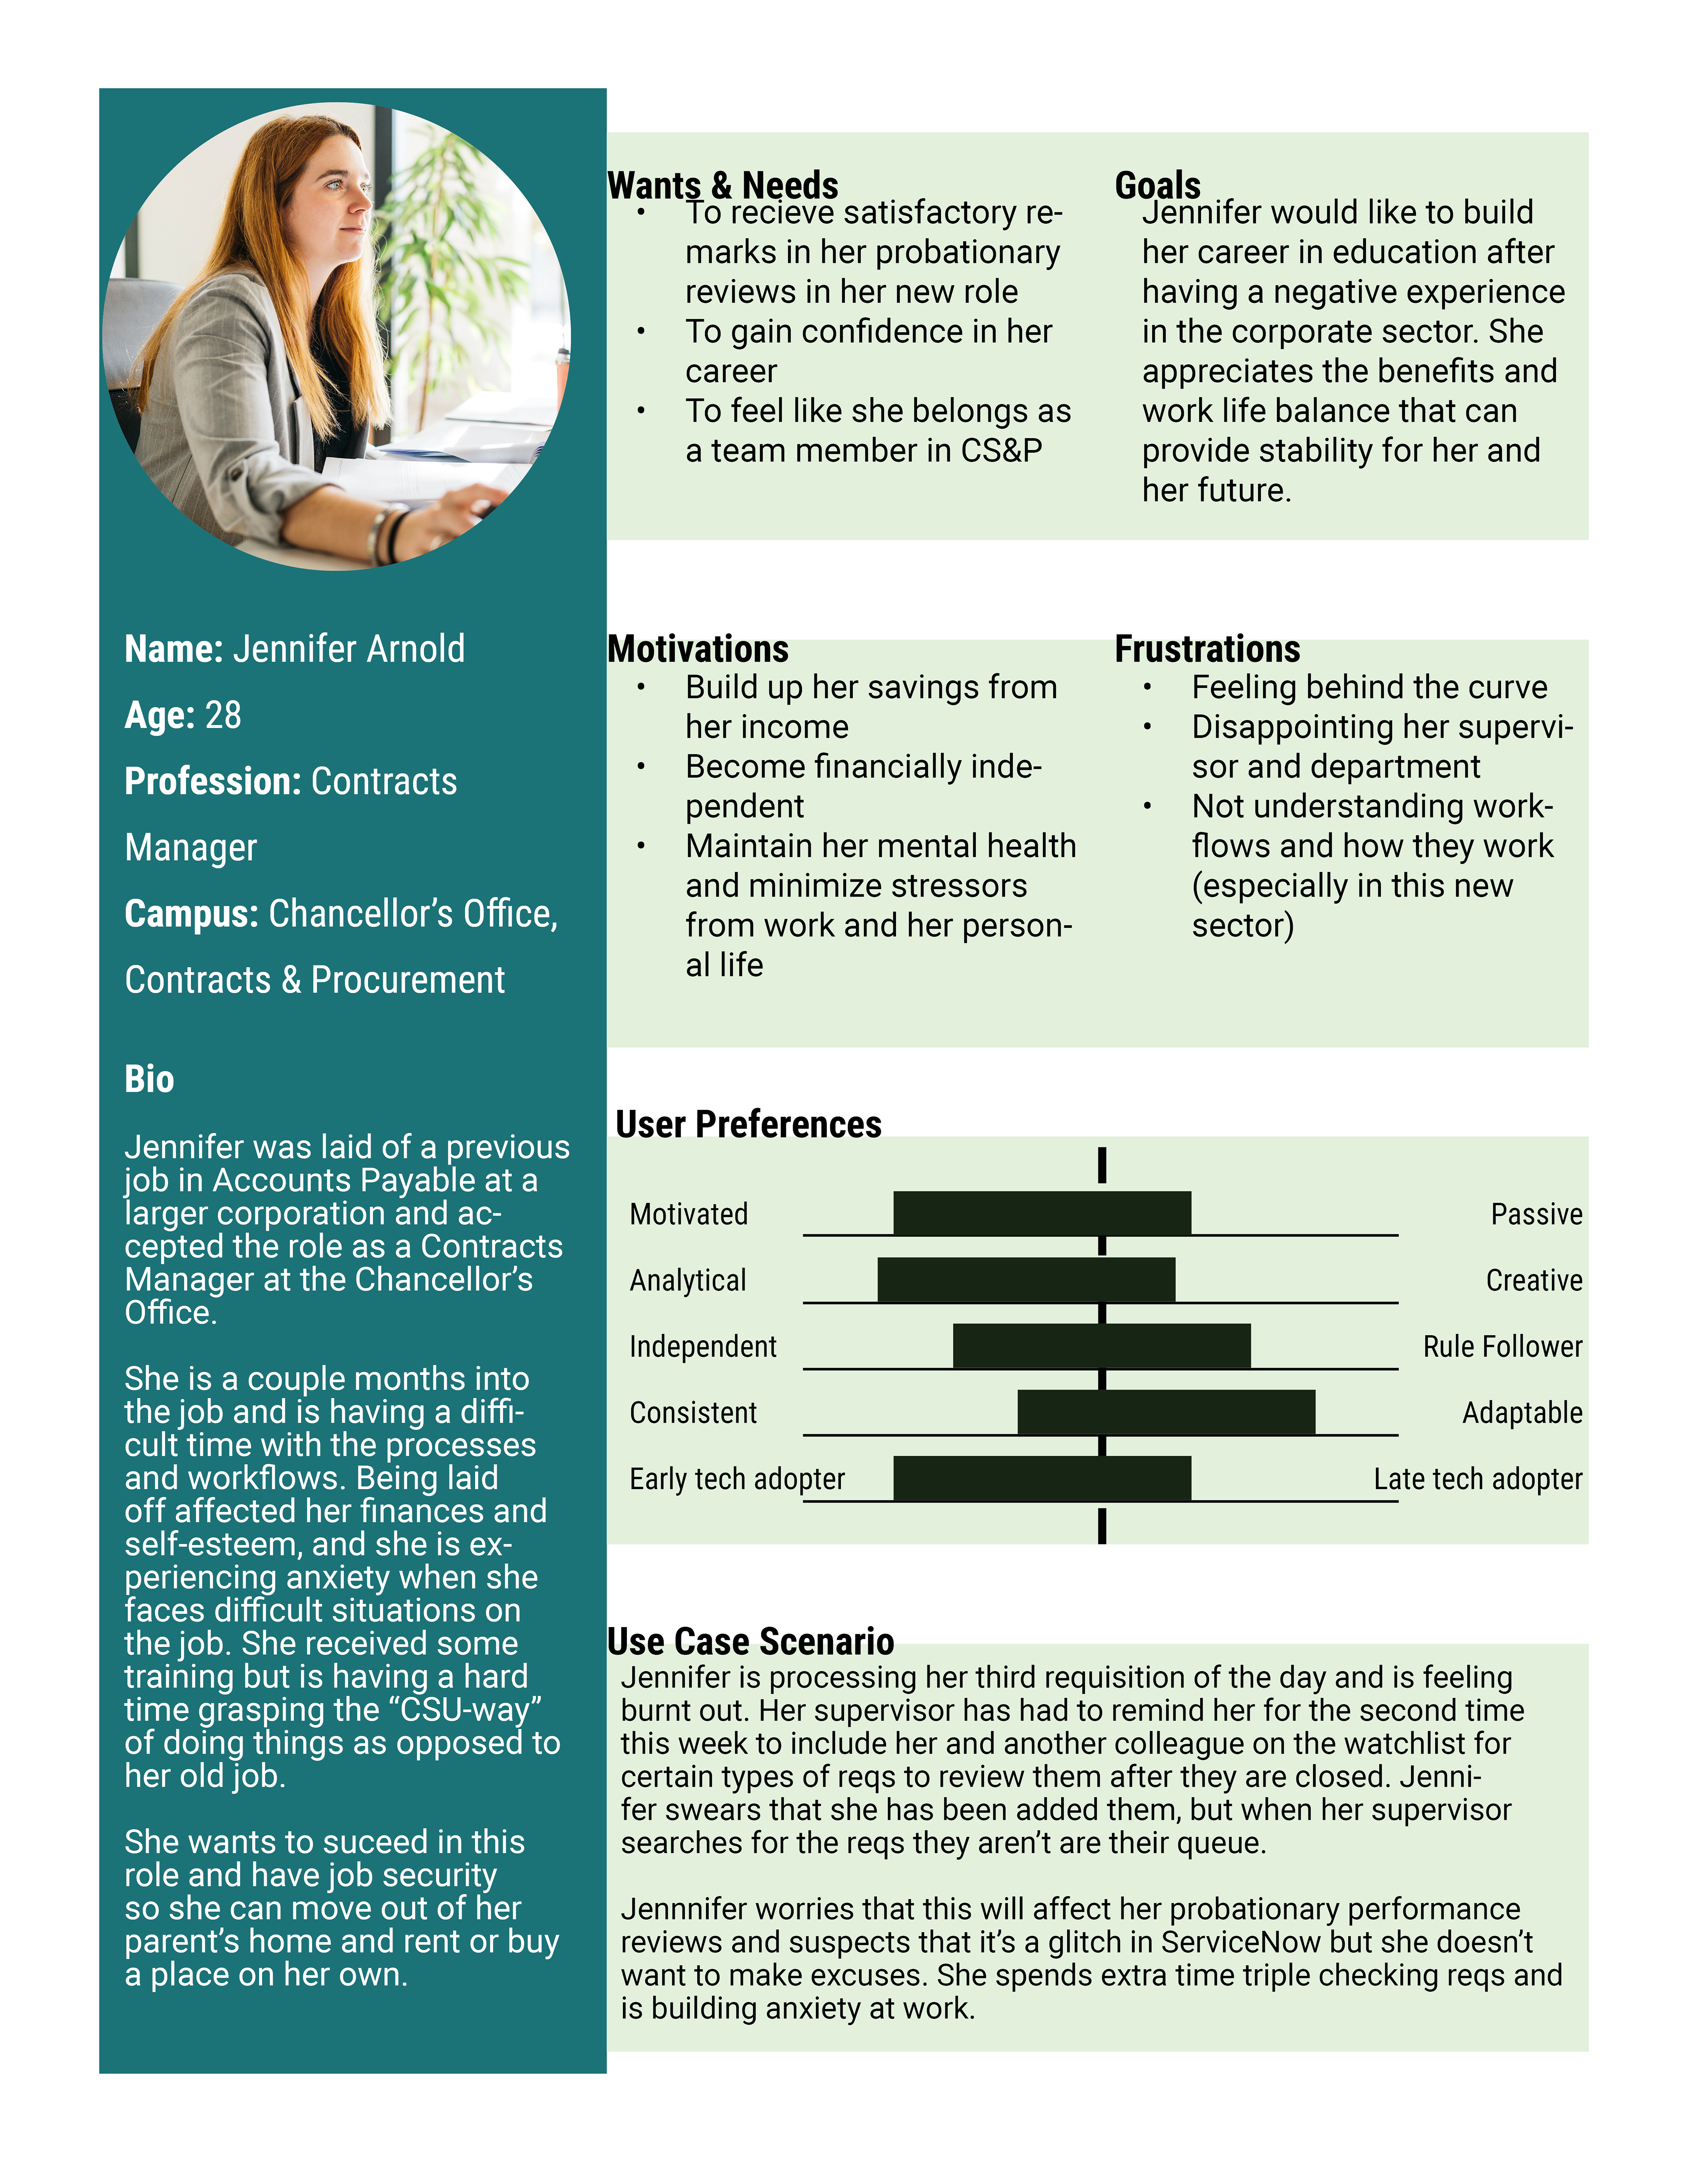
User Persona - "Jennifer"
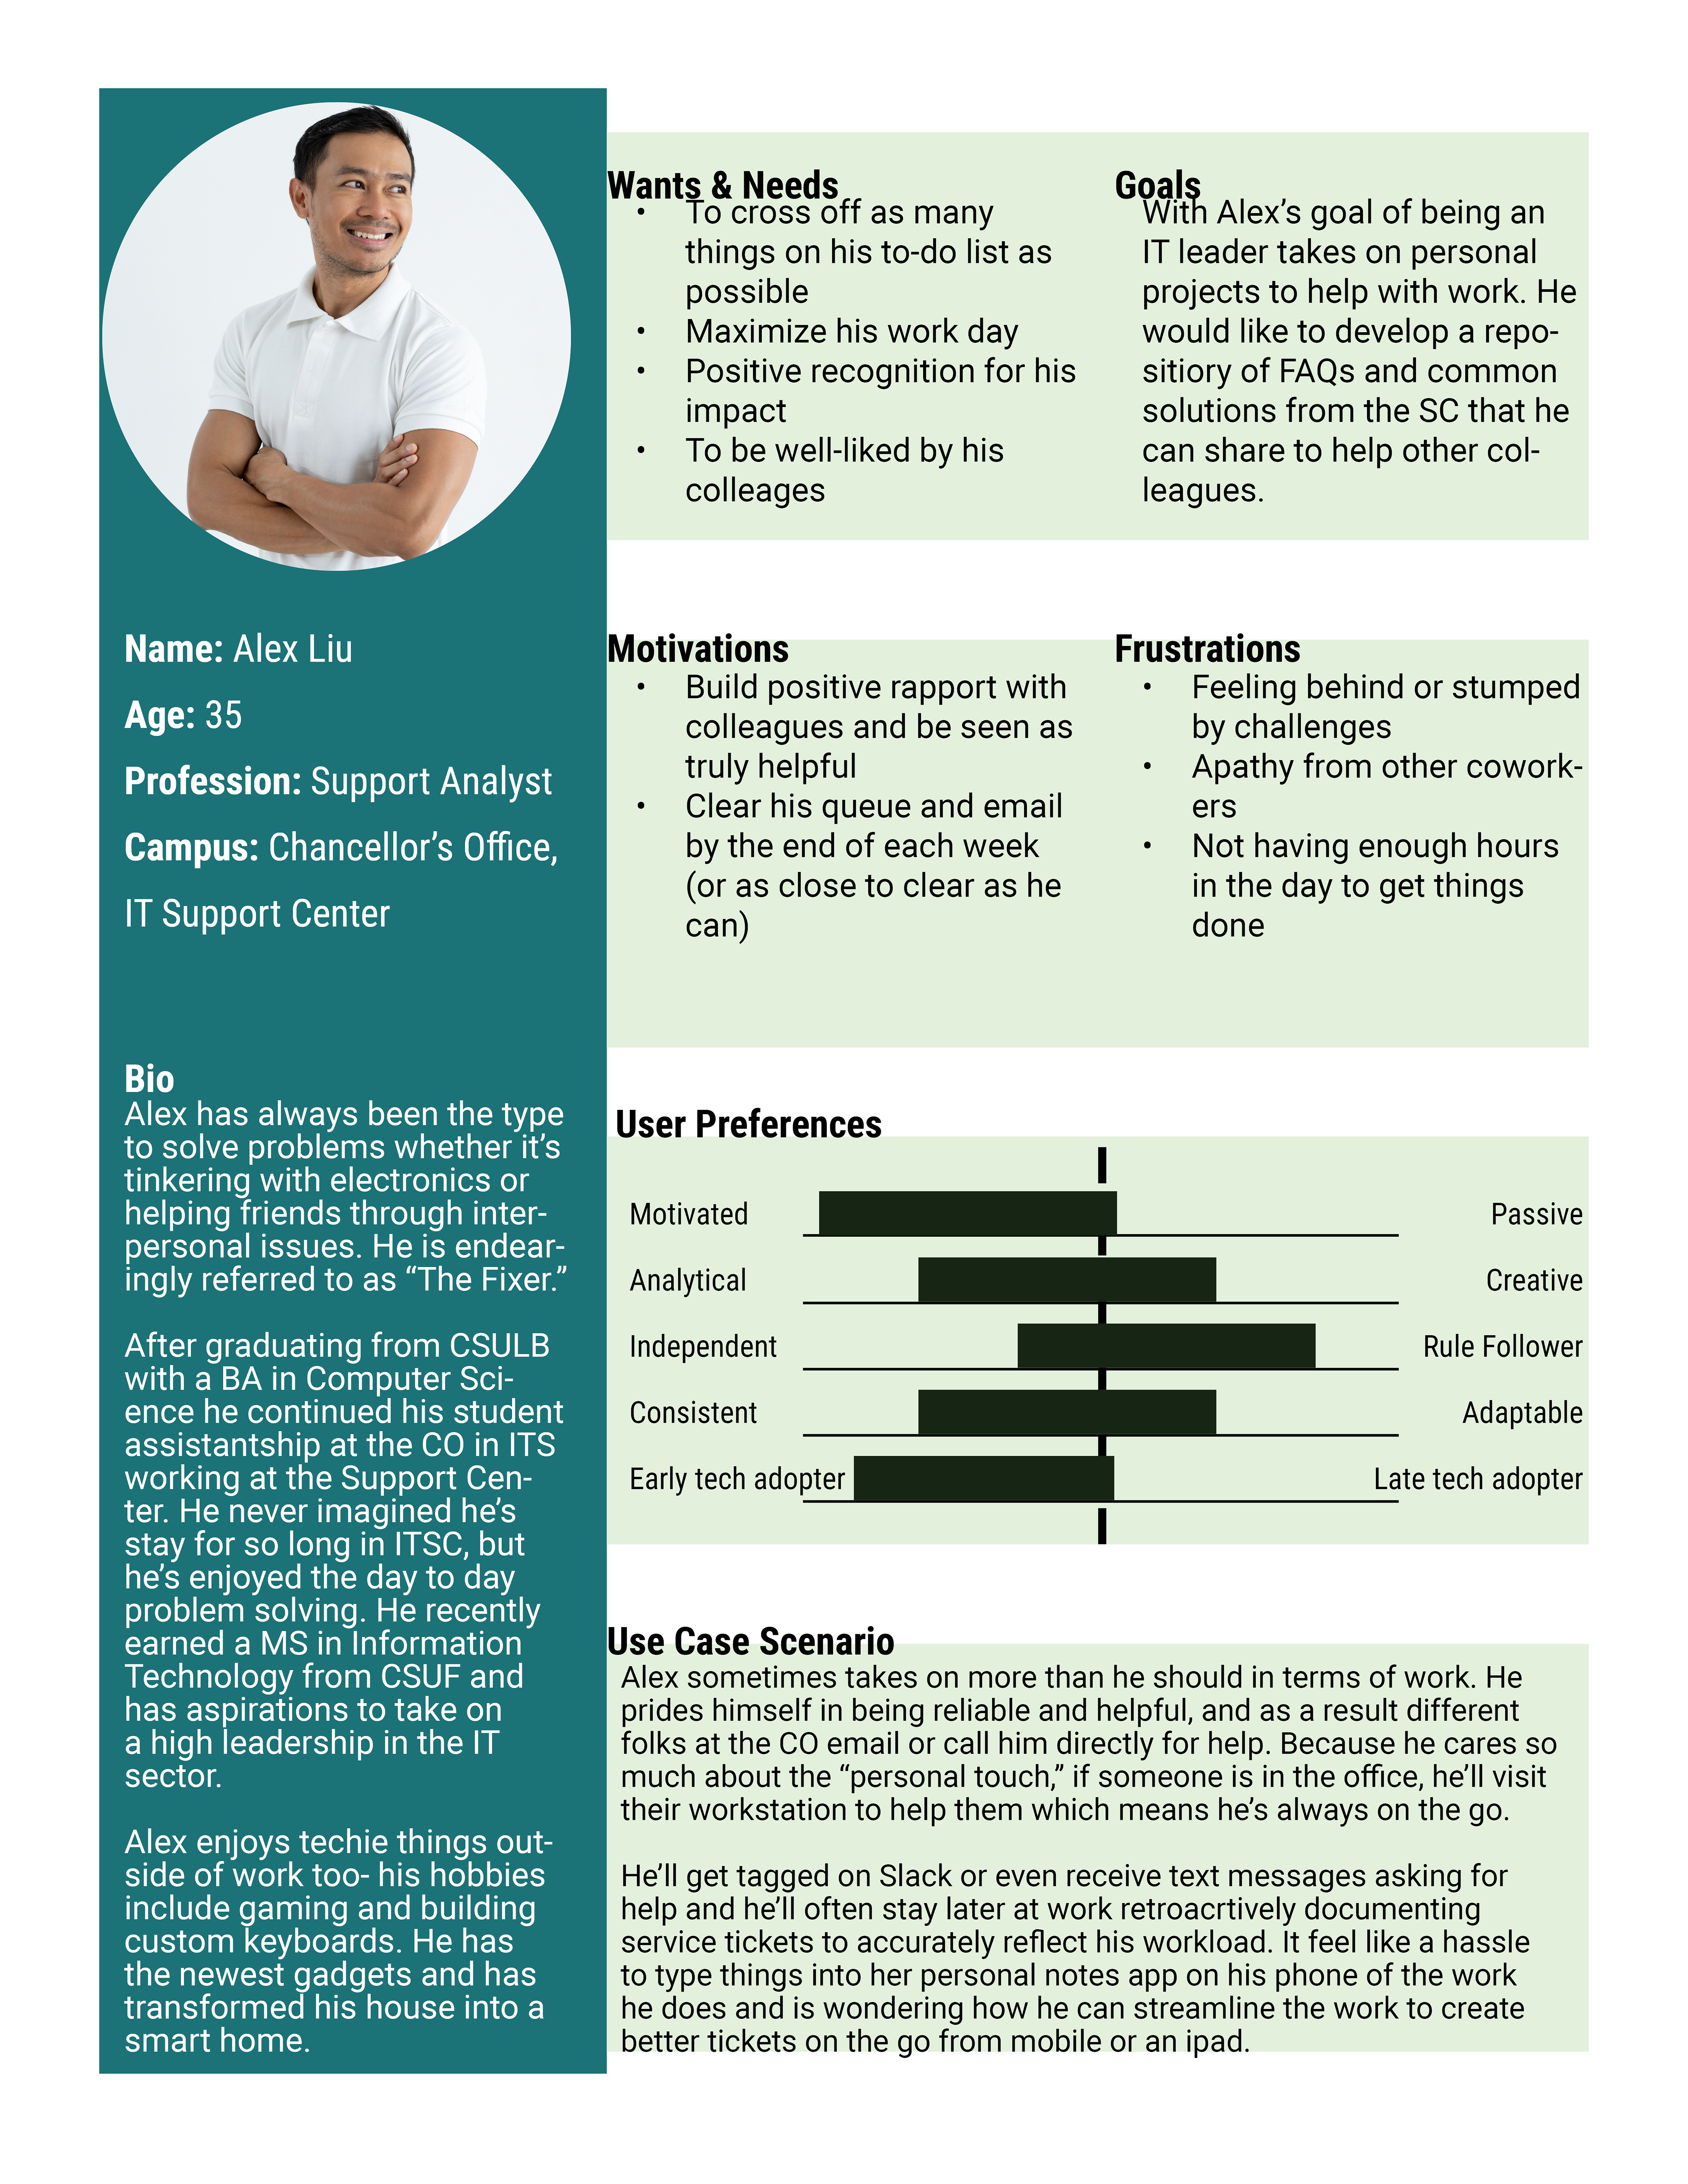
User Persona - "Alex"
Research Report
During fall 2023, I synthesized the aforementioned data to write a comprehensive research report. I presented the report and summary of research to the IT Service Management team who took the findings and suggested goals into a strategic planning session to implement changes.
Unfortunately a copy of the research report is property of the California State University system. For specific questions regarding research methods or findings, please contact me.